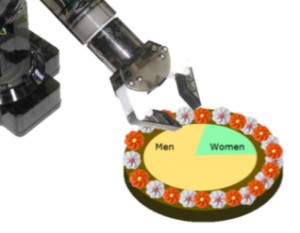
A Piece of the Pie Chart is a robotic gallery installation that addresses gender inequity in tech-centric workplaces. Inspired by industrial production lines, the piece consists of a computer workstation and a food robot. The food robot puts pie charts depicting the gender gap in ratio form onto edible, pre-baked pies. The data changes depending on where the project is exhibited. The data is specific to the geographic location and also depends on the focus of the exhibition space. To be “actionable” the data also needs to be current. Visitors use the robot to create pies using an automatized assembly line. As part of the process, pictures of the pies are automatically disseminated via Twitter. Visitors can then take the pies to their own workplace or have them mailed to the workplaces where the data originated to remind those in charge how large/small the slice of the tech pie women can claim for themselves.
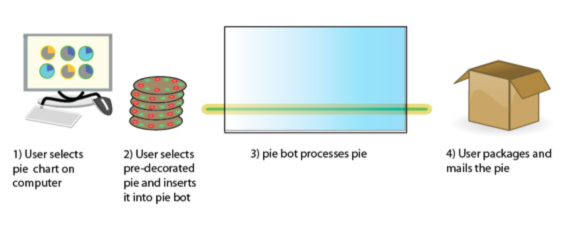
In the exhibition, the machine as well as a computer with keyboard and mouse are displayed on a pedestal with a variable number of vacuum cleaners suspended from the ceiling. Hoses suspended from the vacuum cleaners reach down to the surface of the pedestal where they are attached to a robot arm. Once visitors have decided on a pie depicting a gender ratio, the screen shows them how to place a pre-baked pie into the machine. Some of these pies are stacked next to the machine, ready to be used. When the machine has verified that the pie has been correctly placed, a linear actuator pushes the pie onto a conveyor belt, where a heat gun heats up the chocolate covering of the pie until the chocolate is soft and sticky.
The pie is then transported to one of the robotic arms. The robotic arm guides a hose to the paper pie chart that the visitor has previously chosen. Once the robot arm has reached the diagram selected by the user, it places the hose over the pie chart. When the hose is placed over the diagram, the vacuum cleaner is automatically switched on. While the vacuum cleaner is on, the diagram sticks to the hose. The arm that holds the hose then places the pie chart onto the warm chocolate surface of the pie. Once this has happened, the vacuum cleaner is switched off and releases the paper pie chart decoration that is now sticking to the pie. The conveyor transports the decorated pie under a webcam where it is photographed and the picture posted on Twitter. After that, the pie can be removed from the machine by the visitor. Visitors then package the pie and take it to their work place or mail the pie to the place where the data originated.
Presenting quantitative data about women in tech can begin a discussion about the issue. However I find that translating this data into a graph or chart for a lecture on the topic is not enough. In A Piece of the Pie Chart, I am combining visualization of gender data in the tech workplace with action and humor. Mapping gender data onto edible pies adds material representation to gender statistics. The pies become a multisensory symbol explaining how women fare in the tech industry. This data mapping style adds urgency to the technofeminist cause: It is not a data visualization to be passively consumed; it draws our attention to what the passive consumption of this inequity has produced. What comes out of the machine is an object along with instructions to take action.
I understand technology as a mirror of the values of the society that produces it and for understanding society as a mirror of the technology it uses. Similarly, I see A Piece of the Pie Chart as a mirror of myself, the female tech producer. The machine is a miniature version of an automatized assembly line, a symbol of the industrial revolution, a period in time where tremendous social and technical transformation happened. In my factory-style setup, I am producing not just pies but an audience that will take action towards making technology a more diverse discipline in order to transform tech culture.
I created a number of different machines that explore the question about gender and technology differently. These machines are site-specific and vary in scale. Each machine comes with its own dataset that was assembled specifically to relate to the place where it was exhibited.